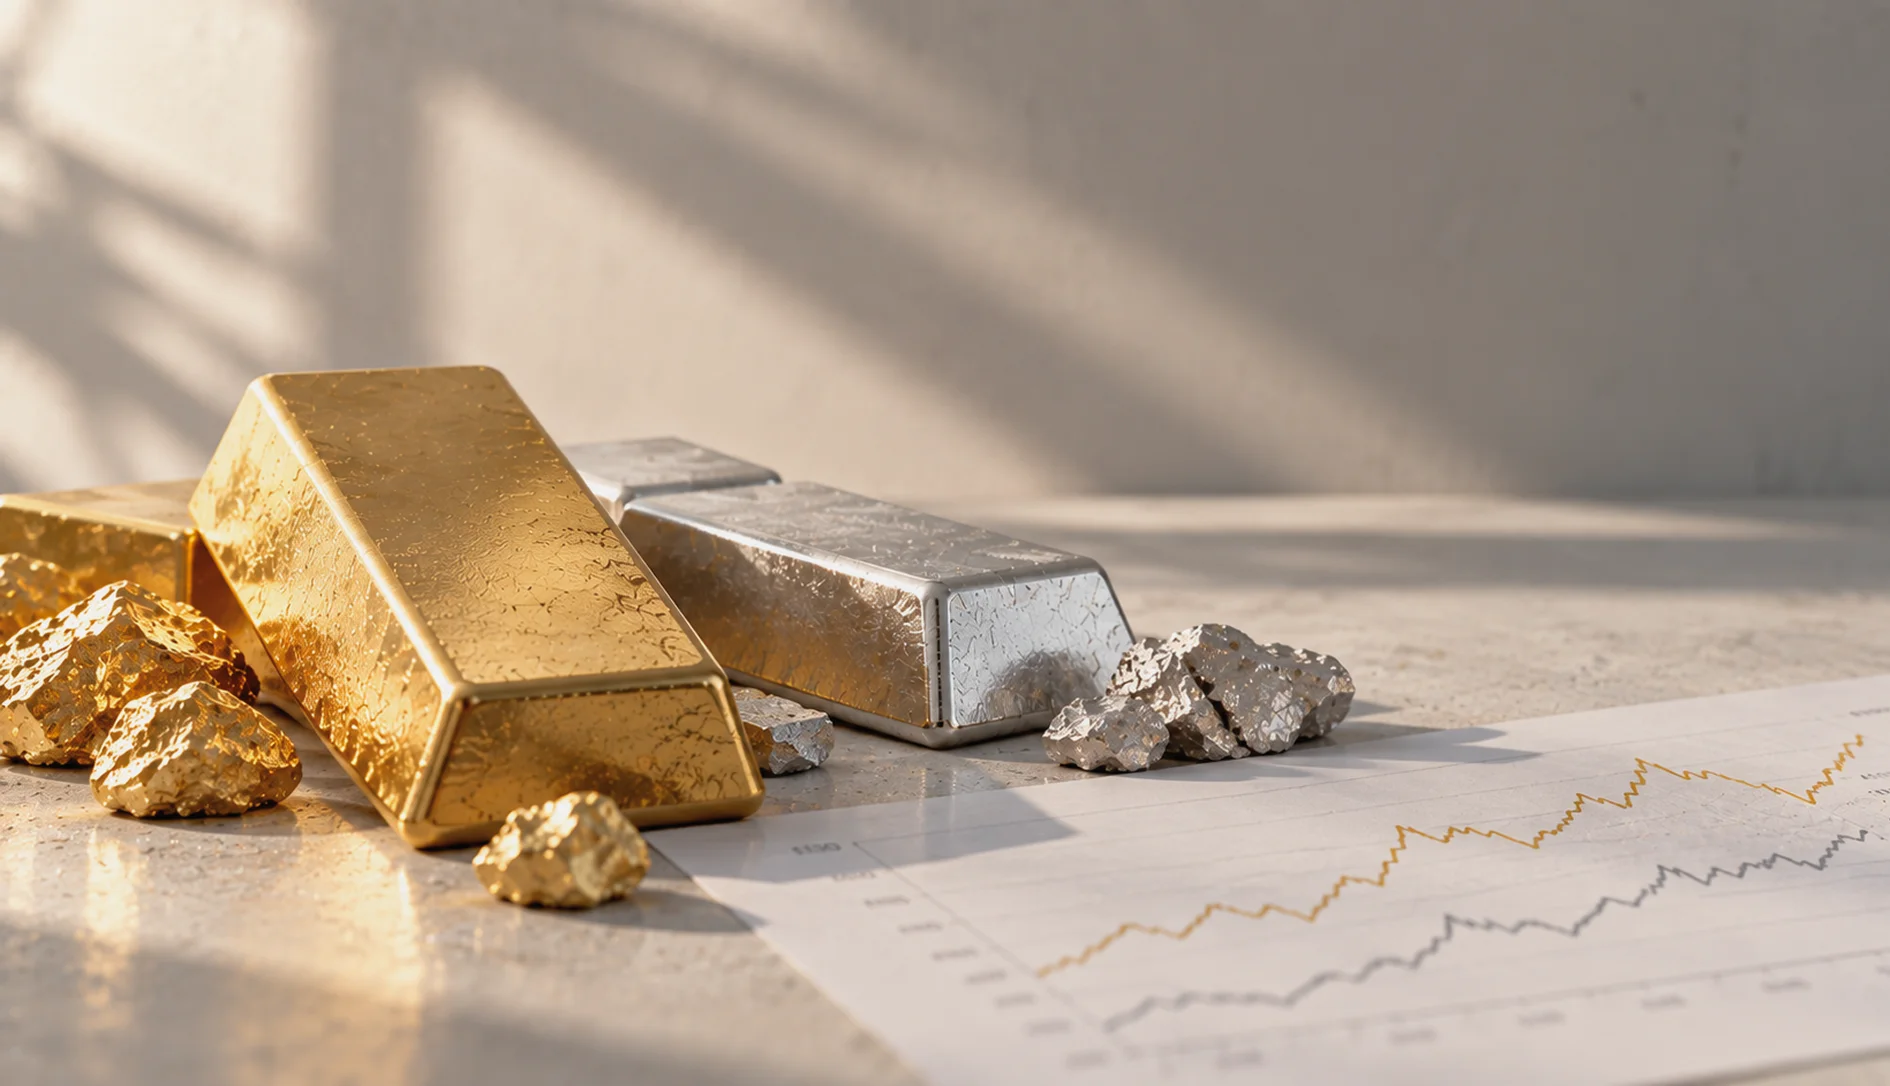
Gold and silver are both precious metals, but they respond differently to economic conditions. Gold draws substantial demand from investors and central banks, while silver has much greater exposure to industrial activity. Silver has historically been more volatile, and the gold/silver ratio measures how their prices compare. Neither metal is guaranteed to protect against losses.
Picture two metals sitting in the same display case. Both are precious, both have been used as money and both attract investors when financial markets become unsettled. Yet one is held in central bank vaults around the world, while a substantial share of the other’s annual demand comes from factories producing electronics, solar cells and other industrial products.
That difference helps explain why gold and silver can rally together one month and move in opposite directions the next. Silver may outperform during a powerful precious-metals rally, only to fall much more sharply when industrial demand weakens or investors suddenly need cash.
The distinction matters whether you collect bullion coins, hold metal-backed funds or trade gold and silver through financial instruments. Their prices may be correlated, but the forces driving them are not identical.
For Canadian traders, there is another variable: the Canadian dollar. A movement in USD/CAD can amplify or offset changes in either metal’s U.S.-dollar price.
What is the main difference between gold and silver?
Gold functions extensively as an investment asset, reserve asset and jewellery material. Silver combines investment demand with substantial industrial consumption. That gives silver greater exposure to the manufacturing cycle, while gold is more strongly influenced by monetary conditions and demand for financial diversification.
The distinction is visible in the demand statistics. The World Gold Council’s full-year 2025 report recorded 2,175 tonnes of gold investment demand and 863 tonnes of central bank purchases. Technology accounted for approximately 323 tonnes, demonstrating that industrial and technological uses were a much smaller component of the gold market.
Silver tells a different story. The Silver Institute’s World Silver Survey 2026 reported that industrial applications consumed 657.4 million ounces in 2025, against total global demand of approximately 1.13 billion ounces. That places industrial use at roughly 58 per cent of annual demand.
Those figures help explain why a weakening global economy can create competing pressures. Investors may seek precious metals as financial protection, while manufacturers reduce their purchases of industrial materials.
| Factor | Gold | Silver |
| Major demand sources | Investment, jewellery and central banks | Industry, investment, jewellery and silverware |
| Industrial exposure | Relatively limited | Substantial |
| Historical volatility | Generally lower | Generally higher |
| Market liquidity | Deeper global trading market | Smaller market with typically wider spreads |
| Central bank demand | Significant | Not a comparable source of demand |
| Mine supply | Predominantly primary gold production | Frequently a by-product of other mining |
| Economic sensitivity | Strongly influenced by monetary conditions | Influenced by monetary and industrial conditions |
Sources: World Gold Council, Gold Demand Trends 2025 and March 2026 comparative research; Silver Institute, World Silver Survey 2026. The characteristics shown are historical tendencies, not fixed rules for future price movements.
Why is silver usually more volatile than gold?
Silver is generally more volatile because its market is smaller and less liquid, and its price responds to both investment flows and industrial expectations. A relatively large change in investor demand can therefore have a stronger effect on silver than on the deeper gold market.
In research published on 18 March 2026, the World Gold Council compared the two metals using historical price and trading data. Its analysis found that silver’s volatility was roughly twice that of gold over the periods studied.
The same research examined spot-market bid-ask spreads from February 2025 to February 2026. Silver’s average spread was approximately nine basis points, compared with two for gold. Wider spreads can increase the cost of entering and exiting positions, especially during turbulent trading sessions.
Industrial demand adds another layer. If investors expect stronger manufacturing activity, silver may benefit from improving demand expectations. If economic growth deteriorates, that same exposure can become a source of selling pressure.
Higher volatility is not another word for higher returns. Silver’s larger movements can work in either direction, and a sharp fall can erase gains accumulated over a much longer period.
Why does industrial demand matter so much for silver?
Silver’s electrical conductivity and other physical properties make it useful in electronics, electrical infrastructure, solar technology and specialized manufacturing. Consequently, changes in industrial production and manufacturing technology can have a meaningful effect on its demand.
Solar energy provides a particularly instructive example. Photovoltaic cells use silver in conductive applications, making solar manufacturing an important source of demand. Growth in solar installations, however, does not automatically translate into proportional growth in silver consumption.
Manufacturers can reduce the amount of silver used in each cell, improve production processes or replace silver in certain applications. These developments can weaken demand even while the number of solar panels being manufactured continues to increase.
That is precisely what happened in 2025. According to the Silver Institute’s April 2026 report, global industrial silver demand declined by three per cent to 657.4 million ounces. Accelerated material-saving measures and substitution in photovoltaic manufacturing outweighed growth in several other industrial applications.
The figures complicate a popular investment narrative. More solar energy does not necessarily mean steadily rising silver prices. Demand depends on how much silver each unit of technology requires, as well as how many units manufacturers produce.
What drives gold demand instead?
Gold responds more strongly to investment behaviour, monetary conditions, jewellery demand and official-sector purchases. Real interest rates, the U.S. dollar and financial uncertainty can influence its attractiveness relative to cash and interest-bearing assets.
Unlike bonds or savings deposits, gold does not pay interest. Higher real interest rates can therefore increase the opportunity cost of holding it. Falling real rates can reduce that disadvantage, although the relationship is not reliable enough to predict every price movement.
Central banks provide an additional demand source that silver largely lacks. The World Gold Council reported 863 tonnes of net central bank purchases during 2025, alongside substantial investment demand from exchange-traded funds and physical bullion buyers.
Gold also has industrial applications, particularly in electronics, but these account for a much smaller share of its overall demand than they do for silver.
This does not make gold immune to crashes. During an acute liquidity crisis, investors may sell bullion to obtain cash. For a closer examination of that behaviour, see our analysis of gold’s safe-haven reputation during previous financial crises.
How does silver’s supply differ from gold’s?
Silver is frequently produced as a by-product of mining other metals, particularly lead, zinc, copper and gold. This means silver production cannot always respond quickly to changes in the silver price itself.
A company operating a copper mine might recover silver alongside its principal product. Even if silver prices rise significantly, expanding copper production solely to recover more silver may not be commercially attractive.
The Silver Institute’s 2026 survey reported global silver mine production of 846.6 million ounces in 2025. Lead and zinc mines remained the largest source of silver, while increased by-product recovery from some copper and gold operations contributed to supply growth.
Recycling adds another supply source, but the economics of recovering silver depend heavily on the product containing it. Recovering metal from discarded electronics is not necessarily as straightforward as melting down old jewellery.
These features help explain why silver supply may adjust slowly even when prices move sharply. They do not, however, guarantee a persistent shortage or rising future prices.
What is the gold/silver ratio?
The gold/silver ratio measures how many ounces of silver have the same market value as one ounce of gold. It is calculated by dividing the gold price per troy ounce by the silver price per troy ounce, using the same currency.
For example, imagine that gold trades at a hypothetical US$3,000 per ounce and silver at US$30. The ratio is 100, meaning one ounce of gold has the same quoted metal value as 100 ounces of silver.
If silver rises to US$40 while gold remains at US$3,000, the ratio falls to 75. Silver has become more expensive relative to gold. If silver instead falls to US$25, the ratio rises to 120.
| Gold price | Silver price | Ratio | Interpretation |
| US$3,000 | US$30 | 100:1 | 100 ounces of silver equal one ounce of gold |
| US$3,000 | US$40 | 75:1 | Silver has strengthened relative to gold |
| US$3,000 | US$25 | 120:1 | Silver has weakened relative to gold |
All prices are hypothetical and provided solely to demonstrate the calculation.
The ratio can change because gold rises, silver falls or both metals move at different rates. It does not reveal which metal will move next.
For consistent calculations, compare prices quoted in the same currency and use a clearly defined observation time. The LBMA publishes internationally recognized gold and silver benchmarks, although their daily auctions occur at different times.
Does a high gold/silver ratio mean silver is cheap?
A high ratio means silver is inexpensive relative to gold compared with the prices used in that calculation. It does not necessarily mean silver is undervalued or that its price is about to rise.
Traders sometimes compare the current ratio with historical ranges, expecting unusually wide differences to narrow eventually. This approach assumes that earlier relationships remain relevant despite changes in industrial demand, investment flows and market structure.
Those assumptions can fail. A prolonged industrial downturn might keep silver weak even while investors continue buying gold. Conversely, strong industrial activity combined with investment demand could push silver substantially higher without requiring gold to fall.
The ratio is most useful as a measure of relative price movement. Treating it as an automatic buy-or-sell signal overlooks the economic forces that caused it to change.
What did the 2025–26 precious-metals rally reveal?
The 2025–26 period demonstrated that gold and silver can experience powerful rallies while responding differently to changing market conditions. Both attracted investment demand, but silver’s smaller market also experienced episodes of unusually severe liquidity pressure.
The Silver Institute reported that falling inventories, changing metal flows and increased investment activity contributed to exceptional silver-market tightness in October 2025. Lease rates and prices rose sharply during that episode.
Gold experienced substantial demand of its own. The World Gold Council’s January 2026 report recorded 53 new all-time highs in the LBMA afternoon gold price during 2025, together with strong investment inflows and central bank buying.
Strong demand did not remove downside risk. Both metals subsequently experienced substantial price swings, illustrating why a bullish supply-and-demand argument should not be confused with protection against short-term losses.
How does the Canadian dollar affect gold and silver returns?
Canadian investors experience an additional source of price movement because gold and silver are commonly quoted internationally in U.S. dollars. Their Canadian-dollar value therefore depends on both the metal price and the USD/CAD exchange rate.
Suppose silver costs a hypothetical US$50 per ounce while one U.S. dollar equals C$1.30. Ignoring transaction costs, the equivalent metal value is C$65.
If silver remains at US$50 but the exchange rate moves to C$1.40 per U.S. dollar, its Canadian-dollar value increases to C$70. Nothing has changed in the U.S.-dollar silver market; the difference comes entirely from the weaker Canadian dollar.
The reverse also applies. A stronger loonie can reduce Canadian-dollar returns even when the metal’s U.S.-dollar price is rising.
The Bank of Canada publishes indicative daily exchange rates that can be used to understand this conversion. Actual transaction rates, dealer spreads and product-specific charges may produce different results.
What makes precious metals particularly relevant to Canada?
Canada has a substantial precious-metals mining industry and an established market for physical bullion. Domestic investors can therefore encounter gold and silver through several different channels, each with its own risks and pricing structure.
Natural Resources Canada reported that Canadian mines produced approximately 200 tonnes of gold in 2024, with Ontario and Quebec accounting for 68 per cent of national production. The country also hosts mining businesses involved in silver and other metals.
Mining shares are not equivalent to physical bullion, however. A company extracting precious metals has operating expenses, debt, geological uncertainty and management risk in addition to exposure to commodity prices.
For someone evaluating the wider range of markets available through NumanCap, distinguishing the commodity from the companies producing it is just as relevant as distinguishing gold from silver.
Physical bullion, ETFs and derivatives: does the instrument matter?
The instrument used to obtain exposure can change the financial outcome even when the underlying metal performs exactly as expected. Physical coins, metal-backed funds, mining shares and derivatives involve different ownership structures, costs and risks.
Physical bullion provides direct ownership of a tangible asset but may involve dealer premiums, storage, insurance and resale spreads. A fund can provide market exposure without personal storage, although its structure, fees and holdings need to be examined.
Mining shares add corporate and stock-market risks. Derivatives, including leveraged products where available, introduce margin requirements, financing costs and the possibility of rapid losses during adverse price movements.
These differences become especially consequential with silver because its historical price volatility has generally exceeded gold’s. A movement that is manageable in an unleveraged holding can create a substantial margin problem in a leveraged position.
How should gold and silver be compared?
The most useful comparison begins with the reason each metal is moving. Gold may respond primarily to interest-rate expectations and investment flows, while silver may be affected by those same forces alongside changes in manufacturing demand and industrial supply.
Consider the time frame, currency, volatility and instrument rather than assuming that both precious metals will deliver comparable results. A historical relationship is evidence of what happened under earlier conditions, not a rule governing future prices.
Before assessing any trading service, it is also worth reviewing its published conditions and independent feedback. Reading customer reviews and ratings alongside the applicable product documentation can provide additional context, although reviews do not establish future trading outcomes.
Frequently asked questions
Why is silver more volatile than gold?
Silver generally has a smaller and less liquid trading market, while its demand is more heavily influenced by industrial activity. Changes in manufacturing expectations and investment flows can therefore produce amplified price movements. World Gold Council research published in March 2026 found that silver’s historical volatility was roughly twice that of gold over the periods examined.
What does a gold/silver ratio of 100 mean?
A ratio of 100 means that one ounce of gold has the same quoted market value as 100 ounces of silver. The ratio is calculated by dividing the gold price per ounce by the silver price per ounce. It measures relative value but does not establish that either metal is overpriced or undervalued.
Can silver prices fall even when solar energy is growing?
Yes. Solar manufacturers can reduce the quantity of silver required per cell or substitute other materials in some applications. The Silver Institute reported that these developments contributed to declining photovoltaic silver demand in 2025 despite continuing growth in several other industrial markets. Manufacturing volume alone does not determine the amount of silver consumed.
Is gold or silver more affected by the Canadian dollar?
Both metals are affected when their U.S.-dollar prices are converted into Canadian dollars. The same percentage change in USD/CAD creates the same percentage currency effect on either metal’s price, assuming other factors remain unchanged. However, their different underlying price movements and volatility can lead to substantially different total Canadian-dollar returns.
Does silver provide the same protection as gold during a recession?
Not necessarily. Silver can attract investment demand during periods of uncertainty, but its substantial industrial exposure may become a disadvantage when manufacturing activity slows. Gold has historically shown different behaviour during financial stress, although it can also fall sharply when investors sell liquid assets to raise cash. Neither metal offers guaranteed protection.
This article is for general educational purposes only and does not constitute financial, investment, tax or legal advice. Historical performance and the hypothetical examples provided do not predict future results. Gold and silver can both experience substantial losses. Leveraged products, including CFDs, carry a high risk of losing money rapidly, potentially exceeding the amount initially committed depending on the product and applicable protections. Product availability, investor protections and relevant rules vary by jurisdiction. Confirm the conditions applicable where you live before trading.